
The U.S. Hispanic population is diverse. These nearly 60 million individuals trace their heritage to Spanish-speaking countries in Latin America and to Spain, each with distinct demographic and economic profiles. But as migration patterns from Latin America change, the origins of U.S. Hispanics are beginning to shift. Here are key facts about how the U.S. Hispanic origin groups are changing and how they differ from one another.
1 Venezuelans, Dominicans and Guatemalans saw the fastest population growth since 2010. From 2010 to 2017, 10 of the 15 largest origin groups grew faster than the Hispanic population overall, which increased 16%. The Venezuelan population in the U.S. increased 76% to 421,000 in 2017, by far the fastest growth rate among Hispanic origin groups. Among groups with populations above 1 million, Dominicans and Guatemalans had the fastest growth. Their populations grew by 37% and 30%, respectively, during this time. Puerto Ricans, the second-largest origin group, saw their population in the 50 states and the District of Columbia jump by 20%, to 5.6 million in 2017. (Another 3.2 million live in Puerto Rico.)
At nearly 37 million, Mexicans are the largest origin group and make up 62% of Latinos, but this share has decreased from a recent peak of 66% in 2008. The Mexican population grew by 11% from 2010 to 2017, tied for the lowest growth rate among the 15 origin groups. The Peruvian and Ecuadorian populations in the U.S. saw similarly slow growth rates.
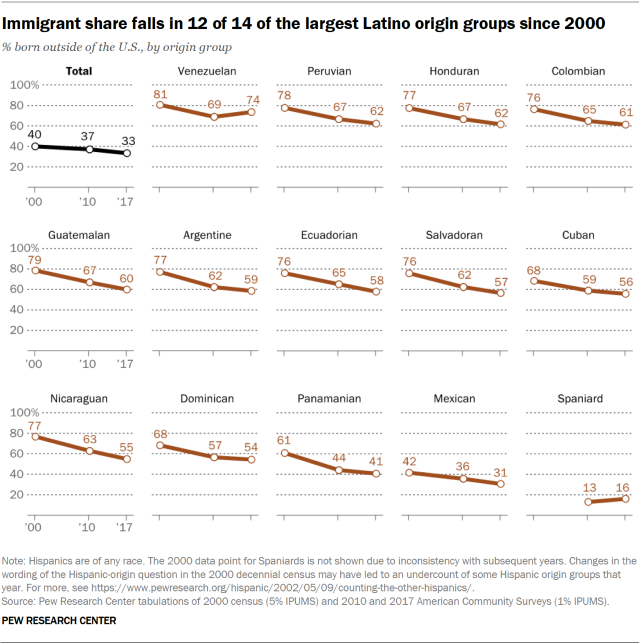
2 Immigrants are a declining share of the Latino population. The share of Latinos in the U.S. who are immigrants declined to 33% in 2017, down from 37% in 2010, due in part to slowing international migration from Latin America. The immigrant share among Nicaraguans fell from 63% to 55% during this time, the largest drop among the 15 largest Latino origin groups. Guatemalans and Ecuadorians followed with a 7 percentage point decline over the same period. Meanwhile, the Venezuelan and Spaniard populations bucked the trend as their foreign-born shares increased between 2010 and 2017.
3 The vast majority of Latinos are U.S. citizens. About 79% of Latinos living in the country are U.S. citizens, up from 74% in 2010. This includes people born in the U.S. and its territories (including Puerto Rico), people born abroad to American parents and immigrants who have become naturalized citizens. Among the origin groups, virtually all Puerto Ricans are U.S. citizens. Spaniards (91%), Panamanians (89%) and Mexicans (79%) have some of the highest citizenship rates, while Hondurans (53%) and Venezuelans (51%) have the lowest rates.
4 A growing share of Latino immigrants are longtime U.S. residents. Nearly four-in-five Latino immigrants (78%) have lived in the U.S. for more than 10 years, up from 64% in 2010. Panamanian (88%) and Mexican (84%) immigrants have the highest shares on this measure. Many Latino immigrants have been in the U.S. for decades – 46% of Latino immigrants have lived in the U.S. for 21 or more years.
Among groups with more recently arrived immigrants, Venezuelan immigrants (58%) and immigrants from Spain (38%) have the highest shares who have been in the U.S. for less than 10 years.
5 The share of Latinos who speak English proficiently has increased. In 2017, 70% of Latinos ages 5 and older spoke English proficiently, up from 65% in 2010. Spaniards (93%), Panamanians (87%) and Puerto Ricans (83%) had the highest shares of English proficiency, while Hondurans (48%), Guatemalans (48%) and Salvadorans (53%) had the lowest shares. The share of Mexicans who speak English proficiently (71%) is similar to that of Latinos overall.
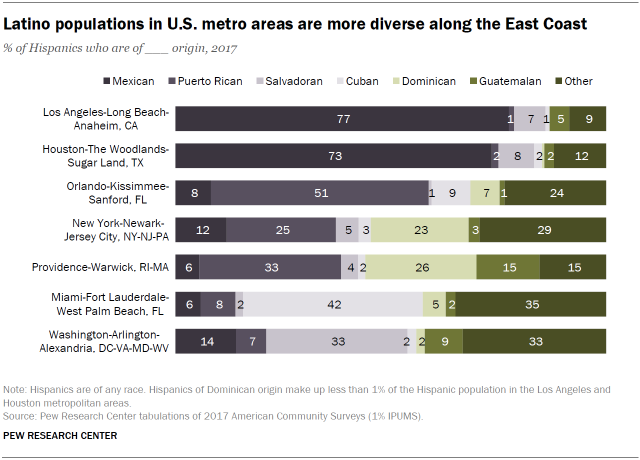
6 The makeup of the Hispanic population varies widely across major metropolitan areas. Mexicans comprise more than two-in-three Hispanics in the Los Angeles and Houston metro areas, reflecting their majority share among the national Hispanic population. But in many other metro areas, other origin groups make up the largest share among Hispanics. Puerto Ricans are the largest group in the Orlando, Florida, metro area, while Salvadorans are the largest in the Washington, D.C., metro area. Cubans are the largest origin group in the Miami metro area.
7 The median age of U.S. Latinos has increased since 2010. Latinos had a median age of 29 years in 2017, up from 27 in 2010, but well below the national median of 38 years for the overall U.S. population. Of the 15 largest Latino origin groups, Cubans and Argentines had the highest median ages, at 40 and 39. Meanwhile, Mexicans (27) and Guatemalans (28) were the youngest groups.
8 Venezuelan-origin Hispanics have the highest share with a bachelor’s degree. About 16% of Latino adults ages 25 and older have a bachelor’s degree or higher, up from 13% in 2010 but lower than the overall U.S. population (32%). Among Latino origin groups, Venezuelans (55%) and Argentines (43%) have the highest shares with a bachelor’s degree or higher, while Guatemalans (10%) and Salvadorans (10%) have the lowest shares. Each origin group has seen this share increase since 2010.
9 Latinos’ economic conditions vary widely by origin group. Argentines had the highest median household income, at $68,000, almost $20,000 more than the overall Latino median ($49,010). Hondurans had the lowest median income at $41,000, about $8,000 lower than the Latino median. Mexicans had a median income ($49,000) similar to the Latino median. (For the most recent income figures for all Hispanics from the U.S. Census Bureau, see “Income and Poverty in the United States 2018.”)
For more information on Hispanics in the 50 states and the District of Columbia, see Pew Research Center’s detailed fact sheets for the 15 largest Hispanic origin groups. The fact sheets describe demographic, employment and income characteristics of each group.
With information from Pew Research Center


